-
Property & Casualty
Property & Casualty Overview

Property & Casualty
We offer a full range of reinsurance products and the expertise of our talented reinsurance team.
Expertise
Publication
High-Low Agreements Can Prevent Large Plaintiff Verdicts
Publication
Medical Marijuana and Workers’ Compensation
Publication
Secondary Peril Events Are Becoming “Primary.” How Should the Insurance Industry Respond?
Publication
Risks of Underinsurance in Property and Possible Regulation
Publication
Benefits of Generative Search: Unlocking Real-Time Knowledge Access
Publication
Battered Umbrella – A Market in Urgent Need of Fixing -
Life & Health
Life & Health Overview

Life & Health
We offer a full range of reinsurance products and the expertise of our talented reinsurance team.

Publication
Thinking Differently About Genetics and Insurance
Publication
Post-Acute Care: The Need for Integration
Publication
Trend Spotting on the Accelerated Underwriting Journey
Publication
Medicare Supplement Premium Rates – Looking to the Past and Planning for the Future U.S. Industry Events
Publication
The Future Impacts on Mortality [Video] -
Knowledge Center
Knowledge Center Overview

Knowledge Center
Our global experts share their insights on insurance industry topics.
Trending Topics -
About Us
About Us OverviewCorporate Information

Meet Gen Re
Gen Re delivers reinsurance solutions to the Life & Health and Property & Casualty insurance industries.
- Careers Careers
Just Your Common Flu ...

Lest we forget where we stood in early 2020, certain heads of state assumed that coronavirus would prove to be but a blip compared with the “common flu.”1 This was not just a handful of politicians but a mainstream view, and indeed the hope on which many people continued to take part in activities that would ultimately prove to be some of the first superspreading events. Nearly two years later, that initial wave of COVID‑19 proved to be but a blip relative to the subsequent waves and death toll so far. Naturally, somewhere after the spring of 2020, minimization narratives comparing COVID‑19 to a seasonal flu faded from the mainstream. COVID‑19 has far from faded, but as we grapple with what the world with endemic SARS‑CoV‑2 looks like, let us re‑open the analogy.
Every year, influenza leads to between 250,000 and 650,000 deaths globally, with the true figure perhaps significantly more.2 Nevertheless, influenza is an epidemic, not a pandemic. In Germany, the 2017/2018 influenza season was a severe one, leading to 25,000 excess deaths. When the total number of COVID‑19 deaths reported for Germany in 2020 proved to be a comparable figure,3 the flu versus COVID‑19 analogy quickly reappeared in the German media. (It was of course a misleading comparison due to younger lives also being affected by COVID‑19 and hence higher number of potential years of life lost relative to influenza). However, with over 100,000 COVID‑19 deaths now reported in Germany, and the global estimated death toll nearing 19 million,4 the analogy is now moot once again.
Clearly, the analogy has limitations when applied to COVID‑19 in its current pandemic state, but what level of excess mortality can we expect to remain in an endemic state? The pessimists among us could imagine increased mobility and zoonotic spillover leading to a pandemic era of sorts.5 Short of this though, and short of predicting the next distinct pandemic, what will living with SARS‑CoV‑2 mean in terms of mid-term mortality? We have a novel virus which is essentially a new cause of death. How do we add this piece to the pie? Is it as simple as adding another flu virus to the causes of death, and doubling flu mortality? If you read no further, the one certain answer I bring is: well, it’s not that simple ...
How bad is seasonal flu?
First, let’s explore the excess mortality due to influenza more closely. Just as we see with COVID‑19, the reported deaths belie the true toll, due in part to lack of reporting and missed diagnoses on death certificates. While deaths with cause of death attributed to influenza were around 3,100 (and with only 1,674 of these being laboratory-confirmed deaths), the actual death toll during Germany’s 2017/2018 flu season was estimated much higher, at 25,000.6,7 Respiratory deaths generally run higher in winters than in the summer. Is this from pollution, COPD, and asthma? The seasonal bit is likely rather attributable to influenza. Common colds (rhinoviruses) also spread more in the winter but rarely lead to fatal complications. Therefore, we analyzed the seasonal excess mortality to establish a proxy for excess deaths from influenza as follows:
- Compare all‑cause mortality in a given winter season against all‑cause mortality in the preceding fall and subsequent spring season.
- Exclude the summer season since it could be impacted by heat waves that also vary across years.
- Flu season proxied by winter is defined as calendar weeks (CW) / months in winter when average weekly death counts are higher than average weekly death counts throughout the year. The weeks sampled were also broadly checked against reports of flu seasons, though in practice will fluctuate from year to year.
Figure 1 shows the selected countries, the seasonal window selected, and the available observation period. Countries were selected based on geographic reach, availability of granular short-term mortality statistics and with significant flu seasons. In addition, a few clear “outliers” are excluded from the observation periods by excluding seasons where flu peaked before or after the defined flu season for each country, as well as previous or following seasons in such cases. Exclusion also occurs for a catastrophic calendar year, a 2011 earthquake in Japan and the SARS‑CoV‑1 epidemic in Hong Kong.

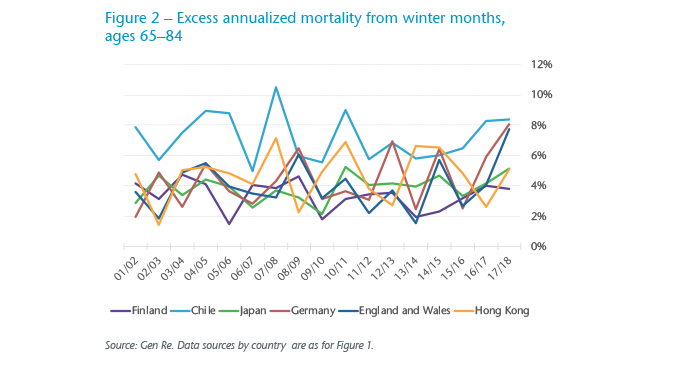
In Figure 2, we observe variability in flu seasons in selected countries. For example, as mentioned earlier, Germany’s 2017/2018 flu season was said to be a severe one, and its resulting excess mortality was highest during the observation period. Germany and England & Wales run in sync over many of the years, perhaps due to similarities both in the annual strains and the flu shots administered – in other words, fluctuation in excess mortality is indeed likely to be driven by seasonal flu, and a bad flu season appears to carry across the channel. Excess mortality in Chile is high despite high vaccination rates, whereas in Finland it’s low, despite strong seasonality.

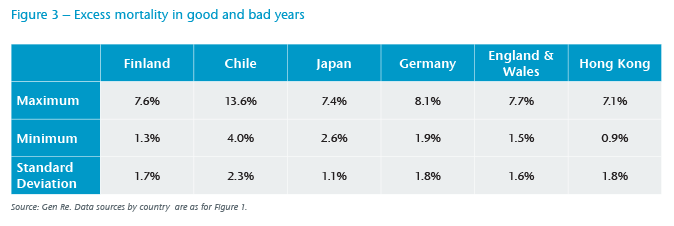
Figure 3 displays excess annualized mortality rates among people aged 65 to 84 from some of the worst flu seasons, as well as the mildest. Here, through the standard deviations, we note less volatility to excess mortality in Japan. On the one hand, Japan exhibits higher population density for potential transmission, as does Hong Kong; on the other hand, Japan and Hong Kong both have long-established hygiene measures, including mask wearing which is more common than in the other countries.14

Similarities and differences
The seasonal flu is, well, seasonal – affecting countries with more pronounced seasonality. COVID‑19 has proven to also impact equatorial climates, but there is some evidence to suggest transmission is higher in the winter,15 hence one may consider seasonal waves may yet be a plausible direction of COVID‑19.
Though both viruses primarily haunt the older and immunocompromised, the burden of disease is arguably slightly more skewed towards that demographic for seasonal flu than it is for COVID‑19, whose mortality rates run roughly in parallel to all‑cause mortality in ages 35 and above. Insurers have not traditionally given much thought to influenza, given that the concentration of risk lies elsewhere, and with detectable infection fatality rates (IFR) only being above age 65.16 Various studies are available on the IFR of COVID‑19, and the general consensus is that it is much higher (possibly 10 times or more) than that of most strains of seasonal flu.17 Also, age shapes of IFR are directionally similar but not the same: compared with seasonal flu, younger people and/or those with fewer comorbidities die as well.18 The comorbidities associated with COVID‑19 would theoretically shield the insurance industry from population-level losses due to underwriting protection, but the main comorbidities increase in prevalence with age, and the industry has observed many young and healthy lives and standard-rated insured lives also being lost to COVID‑19.
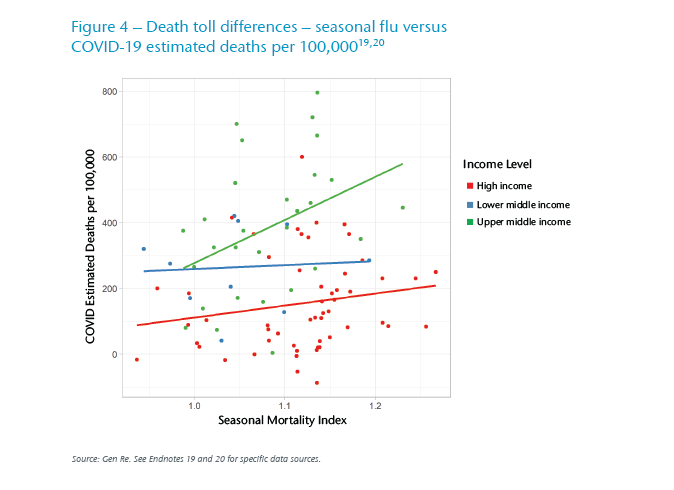
Despite both diseases likely being seasonal and having mortality skewed towards older age groups, COVID‑19 has had a different geographic footprint than an average influenza season. In Figure 4, we observe 89 countries for whom both seasonal mortality and estimated COVID‑19 death toll data is available. From the former we create seasonality similar to the methodology described earlier – winter in excess of spring and summer mortality – to create an index across countries. Tiering these by income level, we see COVID‑19 deaths correlated with the impact of seasonal flu, particularly in the high income and upper middle-income countries, and less so with the lower middle-income countries. This weaker correlation, particularly in lower middle-income countries, may be attributable to the relatively few data points (10 observations out of the total 89 countries); it could also be attributable to other confounding factors, and that we have not standardized for geographical latitude. We do observe that the seasonal flu mortality in this data set is more correlated with high latitudes than the COVID‑19 death toll.

So, on the whole, there are some commonalities which are born out in the Figure 4 results. Yet, the geographic footprint of COVID‑19 has partly been random (unexplained by climate, demographics, even after regressing for other variables such as GDP per capita), and in part has been driven not by clinical attributes of the virus but by behavioral differences, public health culture, and measures taken by respective governments.
For example, Spain and Portugal have achieved high vaccination rates for COVID‑19 on a voluntary basis (and perhaps not entirely coincidentally, also boast relatively high vaccination rates for the seasonal flu in over 65 year olds).21 Does their future look bright?
Just a tail (sic.) of the “haves” and “have nots”?
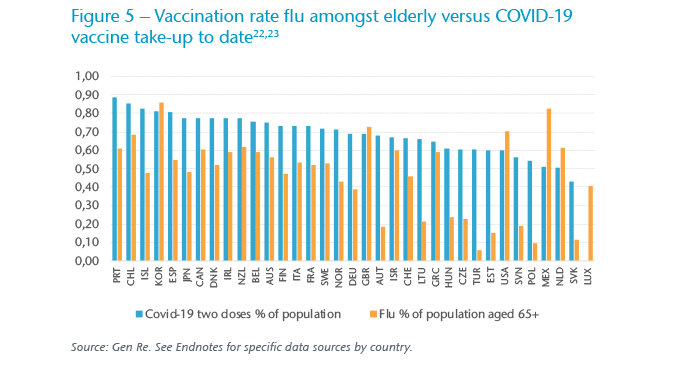
In OECD countries, we note strong correlation (47%) between flu vaccination rates among the elderly, the ages for which the WHO tracks annual vaccine rates, and COVID‑19 full vaccination rates (shown in Figure 5). Secondly, we note unsurprisingly strong correlation (49%) between COVID‑19 death toll and vaccination rate to date; perhaps the correlation would have been higher still had the timing of the waves and the timing of vaccination rollouts also been taken into account. We observe significantly weaker correlation for the seasonal flu, surely due in part to lower vaccination rates, even among the elderly as well as the lower vaccine efficacy.

In the end, it is perhaps not as simple as the vaccination rate being a pure predictor of mortality for either the influenza or COVID‑19. In the insurance industry, other factors have been major determinants, from socioeconomics and underwriting to age distribution.
Nonetheless, we remain hopeful about preventing Spanish flu‑level deaths through better treatment and mooting infections and reinfections by keeping up with vaccine efficacy. The pharmaceutical industry will remain in the limelight for several years to come as it attempts to reduce the impact of the endemic situation on our lives.
Clinical differences behind vaccine efficacy
Seasonal flu has existed for a long time, is endemic, and yet continues to be unpredictable. One key difference with SARS‑CoV‑2 is that influenza, in theory, may have more mutation possibilities. As an RNA virus, SARS‑CoV‑2 has a spike protein which latches to a single ACE receptor, and with a “proofreading mechanism” is expected to sustain a relatively low mutation rate compared with influenza.22 Future mutations are unknown, and much is still unknown about the Omicron variant. Omicron may be more transmissible, and we are eager to understand how the IFR and introduced reinfection or breakthrough are affected, but part of the panic is the significant number of mutations – 10 times more mutations on the spike protein than compared with Delta against the wild type.25 However, mutations are made possible by a large pool to mutate from: the higher the case rate, arguably the stronger the possibility. In the meantime, while we may have many years living with a new coronavirus ahead of us, vaccines will continue to dampen transmission to some extent.
Current evidence indicates that existing vaccines, while having reduced protection against emerging variants, are still protective against severe illness. So, while we have seen a number of mutations, it is unlikely they will proliferate to the extent that vaccines will require guesswork as to whether they match the season’s particular strain, and where there are drastic drops in their efficacy against severe illness.
These days, there are three or more main strains, and many substrains, of influenza, taking a committee of biological experts to select the strains to target for the annual vaccine.26 So while frequent SARS‑CoV‑2 booster shots – perhaps coupled with an annual flu shot, as many medical experts envision – may be needed to maintain protection and to keep up with mutations, it may not merge in the near future into the vaccine hit-and-miss pattern observed with seasonal flu. U.S. data from the CDC shows high variability of influenza vaccine efficacy by year – from under 20% to over 60%.27 Mutations of COVID‑19 so far have not introduced dips in the mRNA vaccine’s ability to prevent hospitalizations or deaths to levels close to these CDC efficacy observations. Perhaps this is one reason for low penetration of flu vaccination which is well short of WHO guidelines for ages above 65; the public simply thinks of the flu shot as hit and miss. On the other hand, recency may drive vaccine take‑up and indeed there are anecdotes of higher flu shot administration in 2020. Thinking optimistically, perhaps both COVID‑19 and influenza vaccine habits may remain higher and increase respectively – especially if they are administered together as one in future, as envisaged. However, one could foresee reversion to historical vaccination rates for the flu, which would have made for a catastrophic 2021 and possibly 2022 in Germany had the COVID‑19 vaccination rate been at 40% instead of 70%.
Mid-term mortality impacts: What does endemic mean in practice?
This article explores a virus which has been with us for much longer than SARS‑CoV‑2 to provide a backdrop as we consider what it means for an additional set of viruses to become endemic. Surely the sustained impact from direct COVID‑19 mortality will not translate so simply as an additional seasonal flu wave; for mortality modelling, one would need to consider a range of calibrations, some of which have been explored above. One big unknown that remains is whether the IFR of COVID‑19 among the unvaccinated will remain stable. It has risen with Delta from the original strain, yet many experts have reason to believe initial strains mature into less virulent ones in a steady state. One theory of where the 1918 Spanish flu “went” is that, rather than through the use of a magic wand or achieving lasting herd immunity without re‑infection, it simply morphed into a considerably less virulent seasonal flu.28
Ultimately, the analogy with the seasonal flu is also a behavioral one – are public conceptions about seasonal flu a bellwether? Mask wearing and suppression measures for the seasonal flu have historically been absent, apart from in pockets of Asia. Will suppression measures and self-restraint be sustainable with COVID‑19? Statistically, the analogy is a question of how to adjust the R0. This comes down to a question of mutations and behavior. The observed Rt of the same variant in China is presumably lower than in the Netherlands among the unvaccinated and susceptible population and may continue as such in the near future.
Beyond the endemic nature of COVID‑19 itself, many other factors influence all‑cause mortality impact due to secondary impacts from the pandemic. There are reasons for short-term pessimism; for example delayed medical treatments and missed diagnoses of cancer and other progressive diseases contributing to unrelated mortality. On the other hand, there are reasons for optimism with the considerable medical breakthroughs arising during the pandemic, and the possibilities of mRNA technologies. Additional green shoots may be the partial crowd out of other diseases, given the considerable comorbidities associated with COVID‑19 outcomes, and indeed the overlapped mortality with the seasonal flu.
With many thanks to Hanna Speller and Yutaro Kameda for their respective analytical contributions.


